Another one so I won't forget. Let's do some setup:
%matplotlib inline
from matplotlib import pylab
from matplotlib.font_manager import FontProperties
Let's assume you have a plot and you want to move legend outside of the plot window. Like this:
pylab.plot(range(10), label="Plot 1")
pylab.plot(range(10, 0, -1), label="Plot 2")
pylab.legend()

Legend overlapping with a plot
See how legend overlaps with the plot. Fortunately matplotlib allows me to move legend out of the way, kinda sorta.
pylab.plot(range(10), label="Plot 1")
pylab.plot(range(10, 0, -1), label="Plot 2")
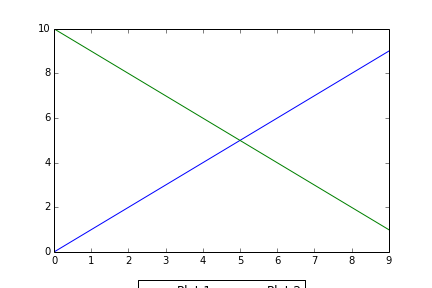
pylab.legend(loc=9, bbox_to_anchor=(0.5, -0.1))

Legend outside of plot area
A little bit better! bbox_to_anchor kwarg sets legend to be centered on X axis and below that axis. For some unfathomable reason you'll need to add loc=9 so the legend is actually centered.
Let's tweak this a bit:
pylab.plot(range(10), label="Plot 1")
pylab.plot(range(10, 0, -1), label="Plot 2")
pylab.legend(loc=9, bbox_to_anchor=(0.5, -0.1), ncol=2)

Legend outside of the plot area with two columns.
You may pass ncol kwarg that sets the number of columns in the legend.
Now plot labels are on the same level and we have saved some space.
Note
If you have long legend it might be worth to decrease font size, like that:
fontP = FontProperties()
fontP.set_size('small')
pylab.legend(prop = fontP, ....)
So far so good, but if you try to save this image legend will get cut in half.

When saving to file legend would be cut in half.
To fix this you'll need to:
- Set bbox_inches="tight" keyword argument
- Pass legend as additional_artists kwarg argument. This argument takes a list so you'll need to append legend somewhere.
Here is an example:
pylab.plot(range(10), label="Plot 1")
pylab.plot(range(10, 0, -1), label="Plot 2")
art = []
lgd = pylab.legend(loc=9, bbox_to_anchor=(0.5, -0.1), ncol=2)
art.append(lgd)
pylab.savefig(
    "/tmp/foo-fixed.png",
    additional_artists=art,
    bbox_inches="tight"
)